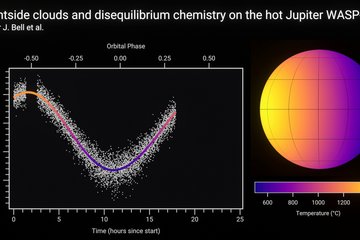
The animation shows the results of the measurements carried out with the MIRI spectrograph of the JWST to characterise the exoplanet GJ 1214 b. From left to right: temperature curve along the east-west direction, centred around longitude zero, which indicates the point directly below the central star; heat map of the planet’s surface in Kelvin; emission spectra corresponding to the planet’s illumination phases shown in the centre (white data points). Three line indicate calculated spectra for three different temperatures in Kelvin (coloured).
More information in the press release “A reluctant exoplanet lifts its veil – a bit”.


